
Introduction
Fault Tree Analysis (FTA) is a top-down, deductive failure analysis method used to determine the cause of system failures. It was initially developed in the 1960s by Bell Laboratories to analyze the safety of the Minuteman missile system. FTA is widely used in various industries, including aerospace, nuclear power, chemical process, and more, to assess the reliability and safety of complex systems.
The primary purpose of Fault Tree Analysis is to identify the root causes of potential system failures and to quantify the probability of those failures occurring. This helps in designing more reliable systems and implementing preventive measures.
Process of Fault Tree Analysis
Define the Top Event
In the context of Fault Tree Analysis (FTA), the “Top Event” is the specific system-level failure or undesired event that the analysis aims to investigate. The first step is to clearly define the undesired event (top event) that you want to analyze. This is typically a system-level failure or hazard.
Steps to Define the Top Event:
Step 1: Identify the System or Process: Determine the system, process, or operation that you are analyzing. This could be anything from a mechanical system, like an engine, to a process in a manufacturing plant.
Step 2: Determine the Undesired Outcome: Clearly state the undesired outcome or failure mode. This could be a failure to perform a required function, an operational error, a safety hazard, or any other specific problem.
Step 3: Be Specific and Measurable: Ensure that the Top Event is clearly defined and measurable. Avoid vague or ambiguous descriptions. For example, instead of saying “system failure,” specify “system shutdown due to power loss.”
Step 4: Consider the Scope and Impact: Define the Top Event considering the overall impact on the system and its operation. It should represent a significant issue that warrants a detailed analysis to identify root causes and potential mitigations.
Characteristics of a Well-Defined Top Event
The Top Event should be easy to understand and directly related to the system’s critical functions.
It should be something that can be observed or detected through monitoring or inspection.


The event should represent a failure or issue that has a significant impact on the system’s operation, safety, or reliability.
It should be relevant to the goals of the analysis and within the scope of the system being studied.

Develop the Fault Tree
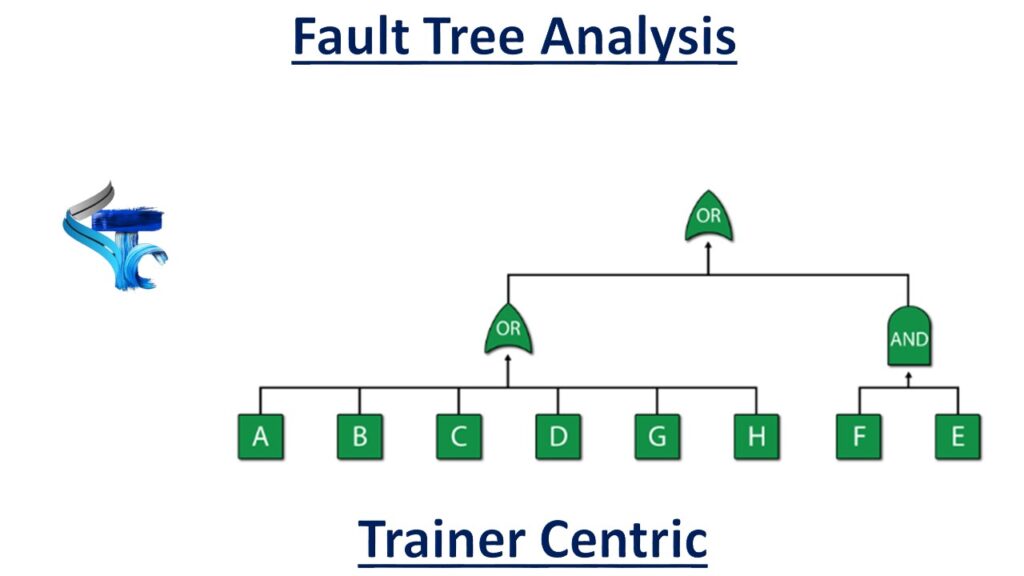
Developing a Fault Tree involves creating a visual diagram that maps out all possible causes of the Top Event. This is done using logic gates (AND, OR) to represent the relationships between different events and their causes.
Steps to Develop the Fault Tree
Step 1: Start with the Top Event: Place the Top Event at the top of the diagram. This is the failure or undesired event you are analyzing.
Step 2: Identify Immediate Causes: Determine the immediate causes that could lead to the Top Event. These causes are placed directly below the Top Event and connected with the appropriate logic gates.
Step 3: Expand to Basic Events: For each immediate cause, continue to break it down into more specific causes until you reach basic events, which are the primary root causes.
Step 4: Use Logic Gates: Use AND gates to represent situations where multiple conditions must be met for an event to occur. Use OR gates to represent situations where any one of several conditions can cause an event.
Example:

Use Logic Gates
Use AND gates to represent situations where multiple conditions must be met for an event to occur. Use OR gates to represent situations where any one of several conditions can cause an event.
Example with AND Gate
Top Event: Data loss in a database system ├── AND Gate: Backup failure │ ├── Backup process did not start (Basic Event) │ └── Backup storage is full (Basic Event) └── AND Gate: System crash ├── Hardware failure (Basic Event) └── Software bug (Basic Event)Quantify the Fault Tree
Assign probabilities to each basic event. These probabilities are based on historical data, expert judgment, or statistical analysis. Calculate the probability of the top event by combining the probabilities of the basic events using the logic gates.
Quantifying a Fault Tree involves assigning probabilities to the basic events and calculating the overall probability of the Top Event. This process helps in understanding the likelihood of the Top Event occurring based on the probabilities of the underlying causes.
Steps to Quantify the Fault Tree
Step 1: Assign Probabilities to Basic Events: Obtain the failure probabilities for each basic event. These probabilities can be derived from historical data, expert judgment, or statistical analysis.
Step 2: Calculate Intermediate Event Probabilities: Use the logic gates to combine the probabilities of basic events and calculate the probabilities of intermediate events.
Step 3: Calculate the Top Event Probability: Combine the probabilities of intermediate events to determine the overall probability of the Top Event.
Example: Quantifying the Engine Fails to Start Fault Tree
Step 1: Assign Probabilities to Basic Events
- Battery is dead: P1=0.05P_1 = 0.05P1=0.05
- Battery connections are loose: P2=0.01P_2 = 0.01P2=0.01
- No fuel in the tank: P3=0.02P_3 = 0.02P3=0.02
- Fuel pump malfunctioning: P4=0.03P_4 = 0.03P4=0.03
- Ignition switch is faulty: P5=0.04P_5 = 0.04P5=0.04
- Spark plugs are worn out: P6=0.02P_6 = 0.02P6=0.02
Step 2: Calculate Intermediate Event Probabilities
- Battery Failure (OR gate):
- Probability PBatteryP_{Battery}PBattery is given by:
- Fuel System Failure (OR gate):
- Probability PFuelP_{Fuel}PFuel is given by: PFuel=P3+P4−(P3×P4)P_{Fuel} = P_3 + P_4 – (P_3 \times P_4)PFuel=P3+P4−(P3×P4) PFuel=0.02+0.03−(0.02×0.03)=0.0494P_{Fuel} = 0.02 + 0.03 – (0.02 \times 0.03) = 0.0494PFuel=0.02+0.03−(0.02×0.03)=0.0494
- Ignition System Failure (OR gate):
- Probability PIgnitionP_{Ignition}PIgnition is given by: PIgnition=P5+P6−(P5×P6)P_{Ignition} = P_5 + P_6 – (P_5 \times P_6)PIgnition=P5+P6−(P5×P6) PIgnition=0.04+0.02−(0.04×0.02)=0.0588P_{Ignition} = 0.04 + 0.02 – (0.04 \times 0.02) = 0.0588PIgnition=0.04+0.02−(0.04×0.02)=0.0588
Step 3: Calculate the Top Event Probability: The Top Event (Engine fails to start) is also an OR gate, combining the probabilities of battery failure, fuel system failure, and ignition system failure:
PTop=PBattery+PFuel+PIgnition−(PBattery×PFuel)−(PBattery×PIgnition)−(PFuel×PIgnition)+(PBattery×PFuel×PIgnition)
- Plugging in the values:
PTop=0.0595+0.0494+0.0588−(0.0595×0.0494)−(0.0595×0.0588)−(0.0494×0.0588)+(0.0595×0.0494×0.0588)P_{Top} = 0.0595 + 0.0494 + 0.0588 – (0.0595 \times 0.0494) – (0.0595 \times 0.0588) – (0.0494 \times 0.0588) + (0.0595 \times 0.0494 \times 0.0588)
PTop=0.0595+0.0494+0.0588−(0.0595×0.0494)−(0.0595×0.0588)−(0.0494×0.0588)+(0.0595×0.0494×0.0588) PTop=0.1677−0.0029−0.0035−0.0029+0.0002=0.1586P_{Top} = 0.1677 – 0.0029 – 0.0035 – 0.0029 + 0.0002 = 0.1586
PTop=0.1677−0.0029−0.0035−0.0029+0.0002=0.1586
The probability of the Top Event (engine fails to start) is approximately 0.1586, or 15.86%. This quantification helps in understanding the overall risk and identifying critical areas that require attention to reduce the likelihood of the undesired event.
Benefits of Quantification of Fault Tree Analysis
Risk Assessment: Provides a clear picture of the risk level associated with the Top Event.
Resource Allocation: Helps prioritize resources and efforts towards mitigating the most critical basic events.
Informed Decision-Making: Supports decision-makers in implementing effective preventive measures.
Limitations
- Data Accuracy: The accuracy of the results depends on the reliability of the probability data for the basic events.
- Complexity: Quantification can become complex for large fault trees with many events and interdependencies.
Analyze and Interpret the Results
After quantifying the fault tree, the next step is to analyze and interpret the results to understand the risk levels and identify areas for improvement. This involves examining the calculated probabilities, identifying critical events, and recommending actions to mitigate the risk.
Step-by-Step Analysis and Interpretation
Examine the Top Event Probability: The probability of the Top Event (engine fails to start) was calculated to be approximately 0.1586, or 15.86%. This means there is a 15.86% chance that the engine will fail to start, based on the probabilities of the basic events.
Identify Critical Basic Events: Review the probabilities of the basic events to identify which ones contribute the most to the Top Event. In our example, the basic events are:
Battery is dead: 5%
Battery connections are loose: 1%
No fuel in the tank: 2%
Fuel pump malfunctioning: 3%
Ignition switch is faulty: 4%
Spark plugs are worn out: 2%
Determine Key Contributors: Calculate the contribution of each basic event to the overall probability of the Top Event. The higher the probability of a basic event, the more critical it is. For instance, the event “Battery is dead” has a probability of 5%, making it a significant contributor compared to others.
Evaluate Intermediate Events: Look at the intermediate event probabilities:
Battery failure: 5.95%
Fuel system failure: 4.94%
Ignition system failure: 5.88%
These values help determine which subsystem (battery, fuel, ignition) has the highest risk.
Propose Mitigation Strategies: Based on the analysis, suggest actions to reduce the probabilities of the critical basic events. For example:
- Battery is dead: Implement regular battery maintenance checks and replacements.
- Battery connections are loose: Ensure secure and regular inspection of battery connections.
- No fuel in the tank: Install a low-fuel warning system and ensure proper fueling procedures.
- Fuel pump malfunctioning: Perform routine checks and maintenance of the fuel pump.
- Ignition switch is faulty: Regularly test the ignition system for faults.
- Spark plugs are worn out: Replace spark plugs at recommended intervals.
Prioritize Actions: Focus on the events with the highest probabilities and the greatest impact on the Top Event. This prioritization ensures efficient allocation of resources to areas with the most significant potential for reducing overall risk.
By analyzing and interpreting the fault tree results, we can identify the most critical causes of the Top Event and take targeted actions to mitigate those risks. Regular maintenance, timely replacements, and robust monitoring systems are essential strategies to reduce the likelihood of system failures. This approach not only improves the reliability and safety of the system but also optimizes resource allocation for preventive measures.
Benefits of Fault Tree Analysis
Systematic Approach: FTA provides a structured method to identify potential failures and their causes.
Visualization: The fault tree diagram visually represents the relationship between causes and the top event, making it easier to understand complex failure mechanisms.
Quantification: It allows for the calculation of the probability of system failures, enabling better risk assessment.
Preventive Action: Helps in identifying weak points in the system and implementing preventive measures to enhance reliability and safety.
Limitations of Fualt Tree Analysis
Time-Consuming: Developing a detailed fault tree can be time-consuming and requires significant expertise.
Subjectivity: The analysis may involve subjective judgment, especially when assigning probabilities to basic events.
Complexity: For highly complex systems, the fault tree can become very large and difficult to manage.
Conclusion
Fault Tree Analysis is a powerful tool for understanding and mitigating system failures. By systematically breaking down the causes of failures and quantifying their probabilities, FTA helps in designing more reliable systems and enhancing overall safety.
![The Power of Storytelling in Corporate Training: Igniting Success and Inspiring Growth [2023]](https://trainercentric.com/wp-content/uploads/2023/06/storytelling-1024x576.jpg)